
 Guide
GuideManagement control: how to combine Excel, Power BI dashboards and AI?
Excel, Power BI dashboards or conversational AI: which tool for your management control, financial reporting and data analysis? A guide to choosing.
Management controllers, CFOs, financial analysts
Business teams find their own figures, within their access rights and with your calculation rules. You get to dig in: one question in plain English prepares the dataset, and you finish the analysis in Excel. And the Monday reports run without you.
Working in M&A, transaction services or at an investment fund? AI for financial due diligence
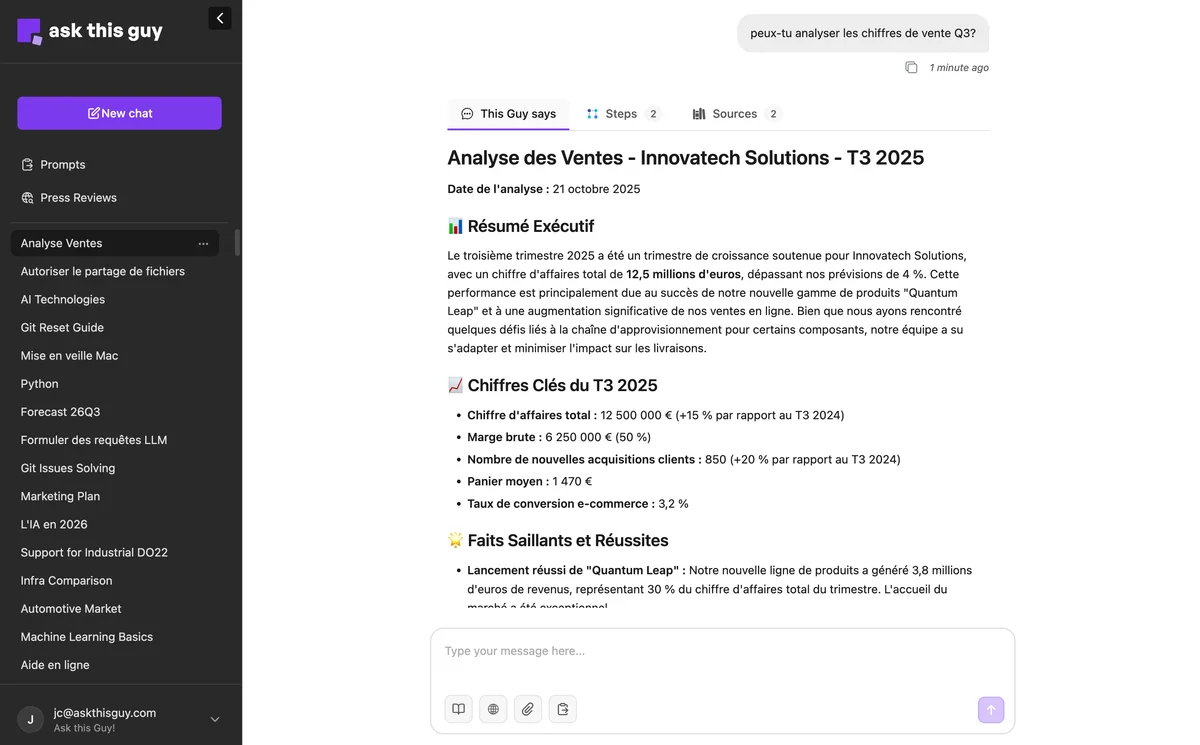
Your week, before and after
Thirty seconds to see what changes in a management controller’s week.
Business teams help themselves
Within their access rights, with your definitions.
You dig in, then Excel
One question prepares the dataset, you finish in a pivot table.
Monday runs itself
Reports, clean-ups and checks run without you.
In practice
Ordinary management-control questions, asked by you or directly by business teams. Each one today means an export, a cross-check and some formatting.
Asked by Management control
Show budget versus actual on Q3 travel expenses, by entity.
 Answer
+€184k
€984k actual against an €800k budget, or +23%. Lyon has the largest overrun, mostly in September.
If a result surprises you, you ask for the detail right away, without reopening a report.
Illustrative examples: the figures come from your data.
Self-sufficient business teams
Sales, purchasing and the executive team ask their questions directly. You stay in control: you set the definitions, and everyone only sees what their access rights allow.
You set the rules
They ask their questions
Sales leadership
Their regionsWhich customers haven’t ordered in 60 days?
Purchasing
PurchasingSpend per supplier this quarter?
Executive team
All entitiesThis month’s gross margin, compared with budget?
What about Excel?
Nobody is asking you to drop your tools. Conversational AI fills the gap between the dashboard and the workbook: the unplanned question, and the dataset you currently build by hand.
See
The dashboard flags that travel expenses are drifting. It says neither where nor why.
Dig
You ask for the detail. The assistant joins expense claims, ledger entries and entities, then prepares the dataset.
Finish
You open the file, build your pivot table, add your assumptions and format it for the meeting.
The longest part of any analysis is building the dataset. The assistant does that pre-processing: it pulls the rows from each source, matches them and filters them. You get a clean file and dig in where you are most comfortable.
Resources
Selected articles and videos to better understand this solution and see how it works in practice.
GuideExcel, Power BI dashboards or conversational AI: which tool for your management control, financial reporting and data analysis? A guide to choosing.
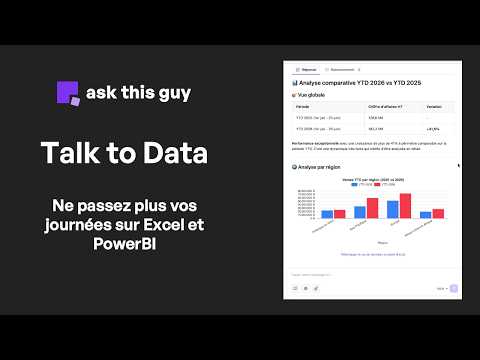 Demo2:00
Management-control demo: query your data in natural language, get figures, charts and an Excel export, without VLOOKUP or an IT ticket.
 Guide
GuideExcel, Power BI, Python, conversational AI: a comparison of data analysis tool families to help you pick the right one for your needs.
 Guide
GuideWhat is AI automation? Benefits, examples, tasks worth automating, and key steps to do it right while using as little AI as possible in production.
 Product
Juggling enterprise systems, getting a simple answer often takes twenty minutes (or a Teams ping to the “person who knows”). Your real data lives in structured databases: it’s often reliable, up to date… but also inaccessible. Most companies seem to overlook it, yet AI can query it in plain language and cross-reference documents and databases in seconds.
No. You write your question in plain English, the way you would message a colleague. The assistant turns it into a query and runs it read-only against the sources you are entitled to see. If you can build a pivot table, you can use this.
Hosting is European and data access is read-only: nothing is changed in your ERP or your database. Permissions inherit from your existing tools, so each person only sees the scope already open to them. A deployment on your own infrastructure is possible.
A few days when the source is a SQL database or a tool with a standard API. Most of the time goes elsewhere: describing the business context, meaning what a column stands for, how you calculate margin, which tables are authoritative. That step is what makes the answers good.
The work that comes back identical: integrating incoming files (invoices, statements, supplier exports), reconciling two systems, consistency checks before close, producing recurring reports and threshold alerts. In practice: if you perform the same handling every week, it can be described once and then runs without you.
The figures come from your sources, not from the model: the assistant generates a query, runs it and returns the result. You can ask to see the detail and the source behind any answer. We also expose documented tables or views rather than the whole schema, which leaves less room for shaky interpretation.
Either works. Our engineers can take the whole thing end to end, or work alongside your finance team and IT so you can extend the use cases yourselves afterwards. In both cases what is built belongs to you and stays portable.
Yes, and it is the most common use in management control. Every answer exports to an Excel file: the figure, but above all the dataset behind it, already joined across your sources and filtered on your question. You finish the analysis in your usual workbook, with your pivot tables and formulas.
Definitions are set once, by management control: what revenue covers, how margin is calculated, which table is the reference. The assistant applies them to every question, whichever team asks it. Everyone works from the same number, each within the scope their access rights allow.
In 30 minutes we look at one task you redo every week, and estimate what it would be worth to stop doing it.