
 Guide
GuideData analysis tools: which family for which need in 2026?
Excel, Power BI, Python, conversational AI: a comparison of data analysis tool families to help you pick the right one for your needs.
For finance, management control and operations teams
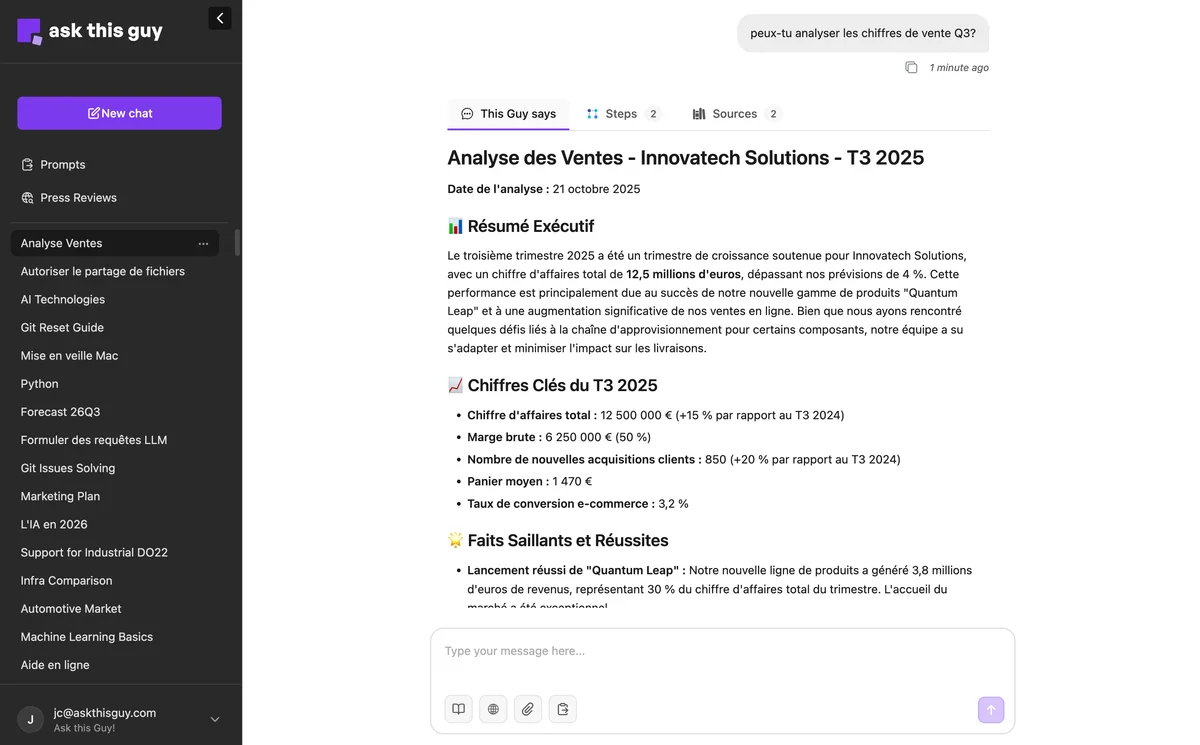
Financial analysis, management control, reporting: ask your question and get the figure, a chart and an Excel export. No SQL, no VLOOKUP, no waiting on IT. Talk to Data connects to your real sources (SQL, Sage, Salesforce, Excel, docs).
2x more users actually using data
Your data is scattered across an ERP, a CRM, a SQL database, Excel files, and internal documents. For management control and financial analysis, every question (“Q3 financial reporting by region?”, “customers without an invoice for 60 days?”) requires an export, a tedious VLOOKUP, then another ask to the data team.
Talk to Data connects to your existing sources (SQL, Sage, Salesforce, Excel, MCP, docs) and answers in natural language, with your business context. It is a truly conversational data-analysis tool: analysts and operations teams get answers themselves, generate charts, and export to Excel/CSV. IT keeps control of access and sources.
SQL, Sage, Salesforce, Excel, MCP, SharePoint. No re-entry, no copy, no ETL to build.
Context configuration, self-learning, and your company documents (RAG) help the AI understand your terms, rules, and workflows.
Fewer manual exports, fewer VLOOKUPs, fewer repetitive BI requests. Permissions inherit from your existing tools.
Dashboard and conversation
Talk to Data does not replace your Power BI or Excel dashboards: it complements them. The dashboard shows how your indicators evolve; the conversation analyses the gaps and explores the drivers.
Great for tracking KPIs over time: revenue, margin, cash. You see what is moving, in a stable, shared visual format.
Great for understanding why a figure moves: query an ERP in natural language, cross-reference sources, isolate a customer, a region or a period, without building a new report for every question.
Resources
Selected articles and videos to better understand this solution and see how it works in practice.
GuideExcel, Power BI, Python, conversational AI: a comparison of data analysis tool families to help you pick the right one for your needs.
 Demo2:00
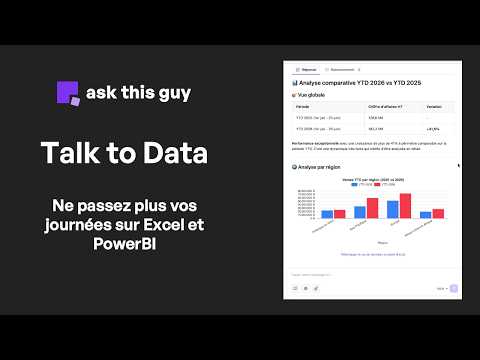
Management-control demo: query your data in natural language, get figures, charts and an Excel export, without VLOOKUP or an IT ticket.
 Guide
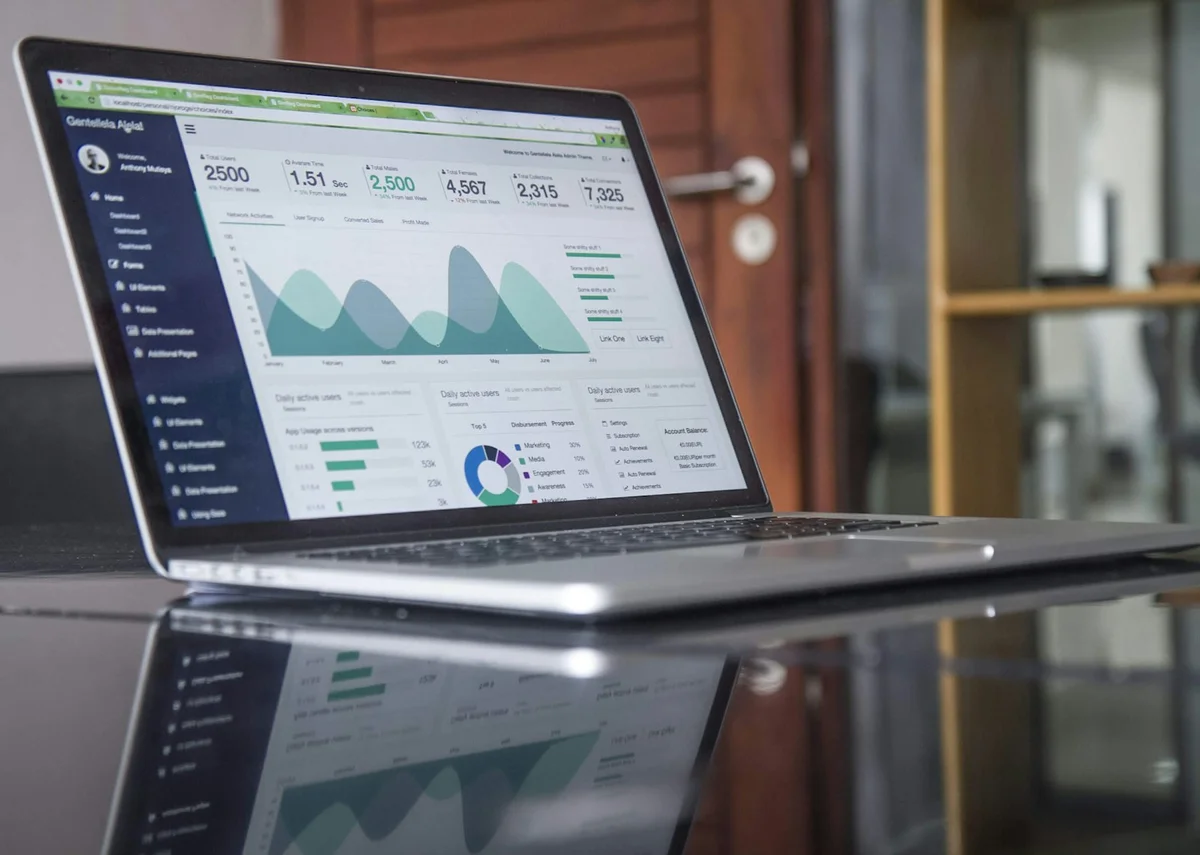
GuideExcel, Power BI dashboards or conversational AI: which tool for your management control, financial reporting and data analysis? A guide to choosing.
 Product
Juggling enterprise systems, getting a simple answer often takes twenty minutes (or a Teams ping to the “person who knows”). Your real data lives in structured databases: it’s often reliable, up to date… but also inaccessible. Most companies seem to overlook it, yet AI can query it in plain language and cross-reference documents and databases in seconds.
You ask your question like you would a colleague (“what is the Q3 financial reporting by region?”). Talk to Data translates the question, queries your connected sources (SQL, Sage, Salesforce, Excel, docs), then returns a figure, a chart and, if needed, an Excel/CSV export. No SQL skills required.
For repetitive, tedious analyses, yes. Instead of chaining exports and VLOOKUPs, you get the answer and the chart directly. Keep Excel for what it does best, and export Talk to Data’s results to Excel/CSV whenever useful.
Power BI is excellent for tracking KPIs in dashboards. Talk to Data is conversational: it explains gaps and explores drivers in natural language. The two are complementary. Talk to Data is also a simple alternative when Power BI’s conversational AI (Fabric Copilot) is too costly to enable.
Yes, it is a core use case: financial analysis, management control, operational monitoring. CFOs, management controllers and business unit directors query their data without depending on IT or BI.
Yes. Talk to Data is read-only and inherits the permissions of your existing tools. IT keeps control of access and sources, and hosting is European.
Show us your sources and a real use case. We’ll show you Talk to Data’s answer live.